CalcStudio
Interactive Calculus Toolkit for Students and Educators


Download - Please Star this Repository to Show Support!!
- It is recommended to download CalcStudio locally using Github Clone!
- For macOS: CalcStudio-mac.zip
Overview
Description: CalcStudio is an interactive calculus learning tool with visualizations of derivatives, integrals, and other calculus concepts (soon to have AI/ML and multivariable concepts). Built from scratch with Python, PyQt5, Matplotlib, and Numpy to support conceptual understanding through dynamic graphs and intuitive PyQt5 UI. Used for tutoring and self-study across AP and early college curriculum. This application is built for individuals who are learning advanced math concepts, CalcStudio breaks down these topics using visuals and interactive sliders and buttons that the user can control.
Main Features:
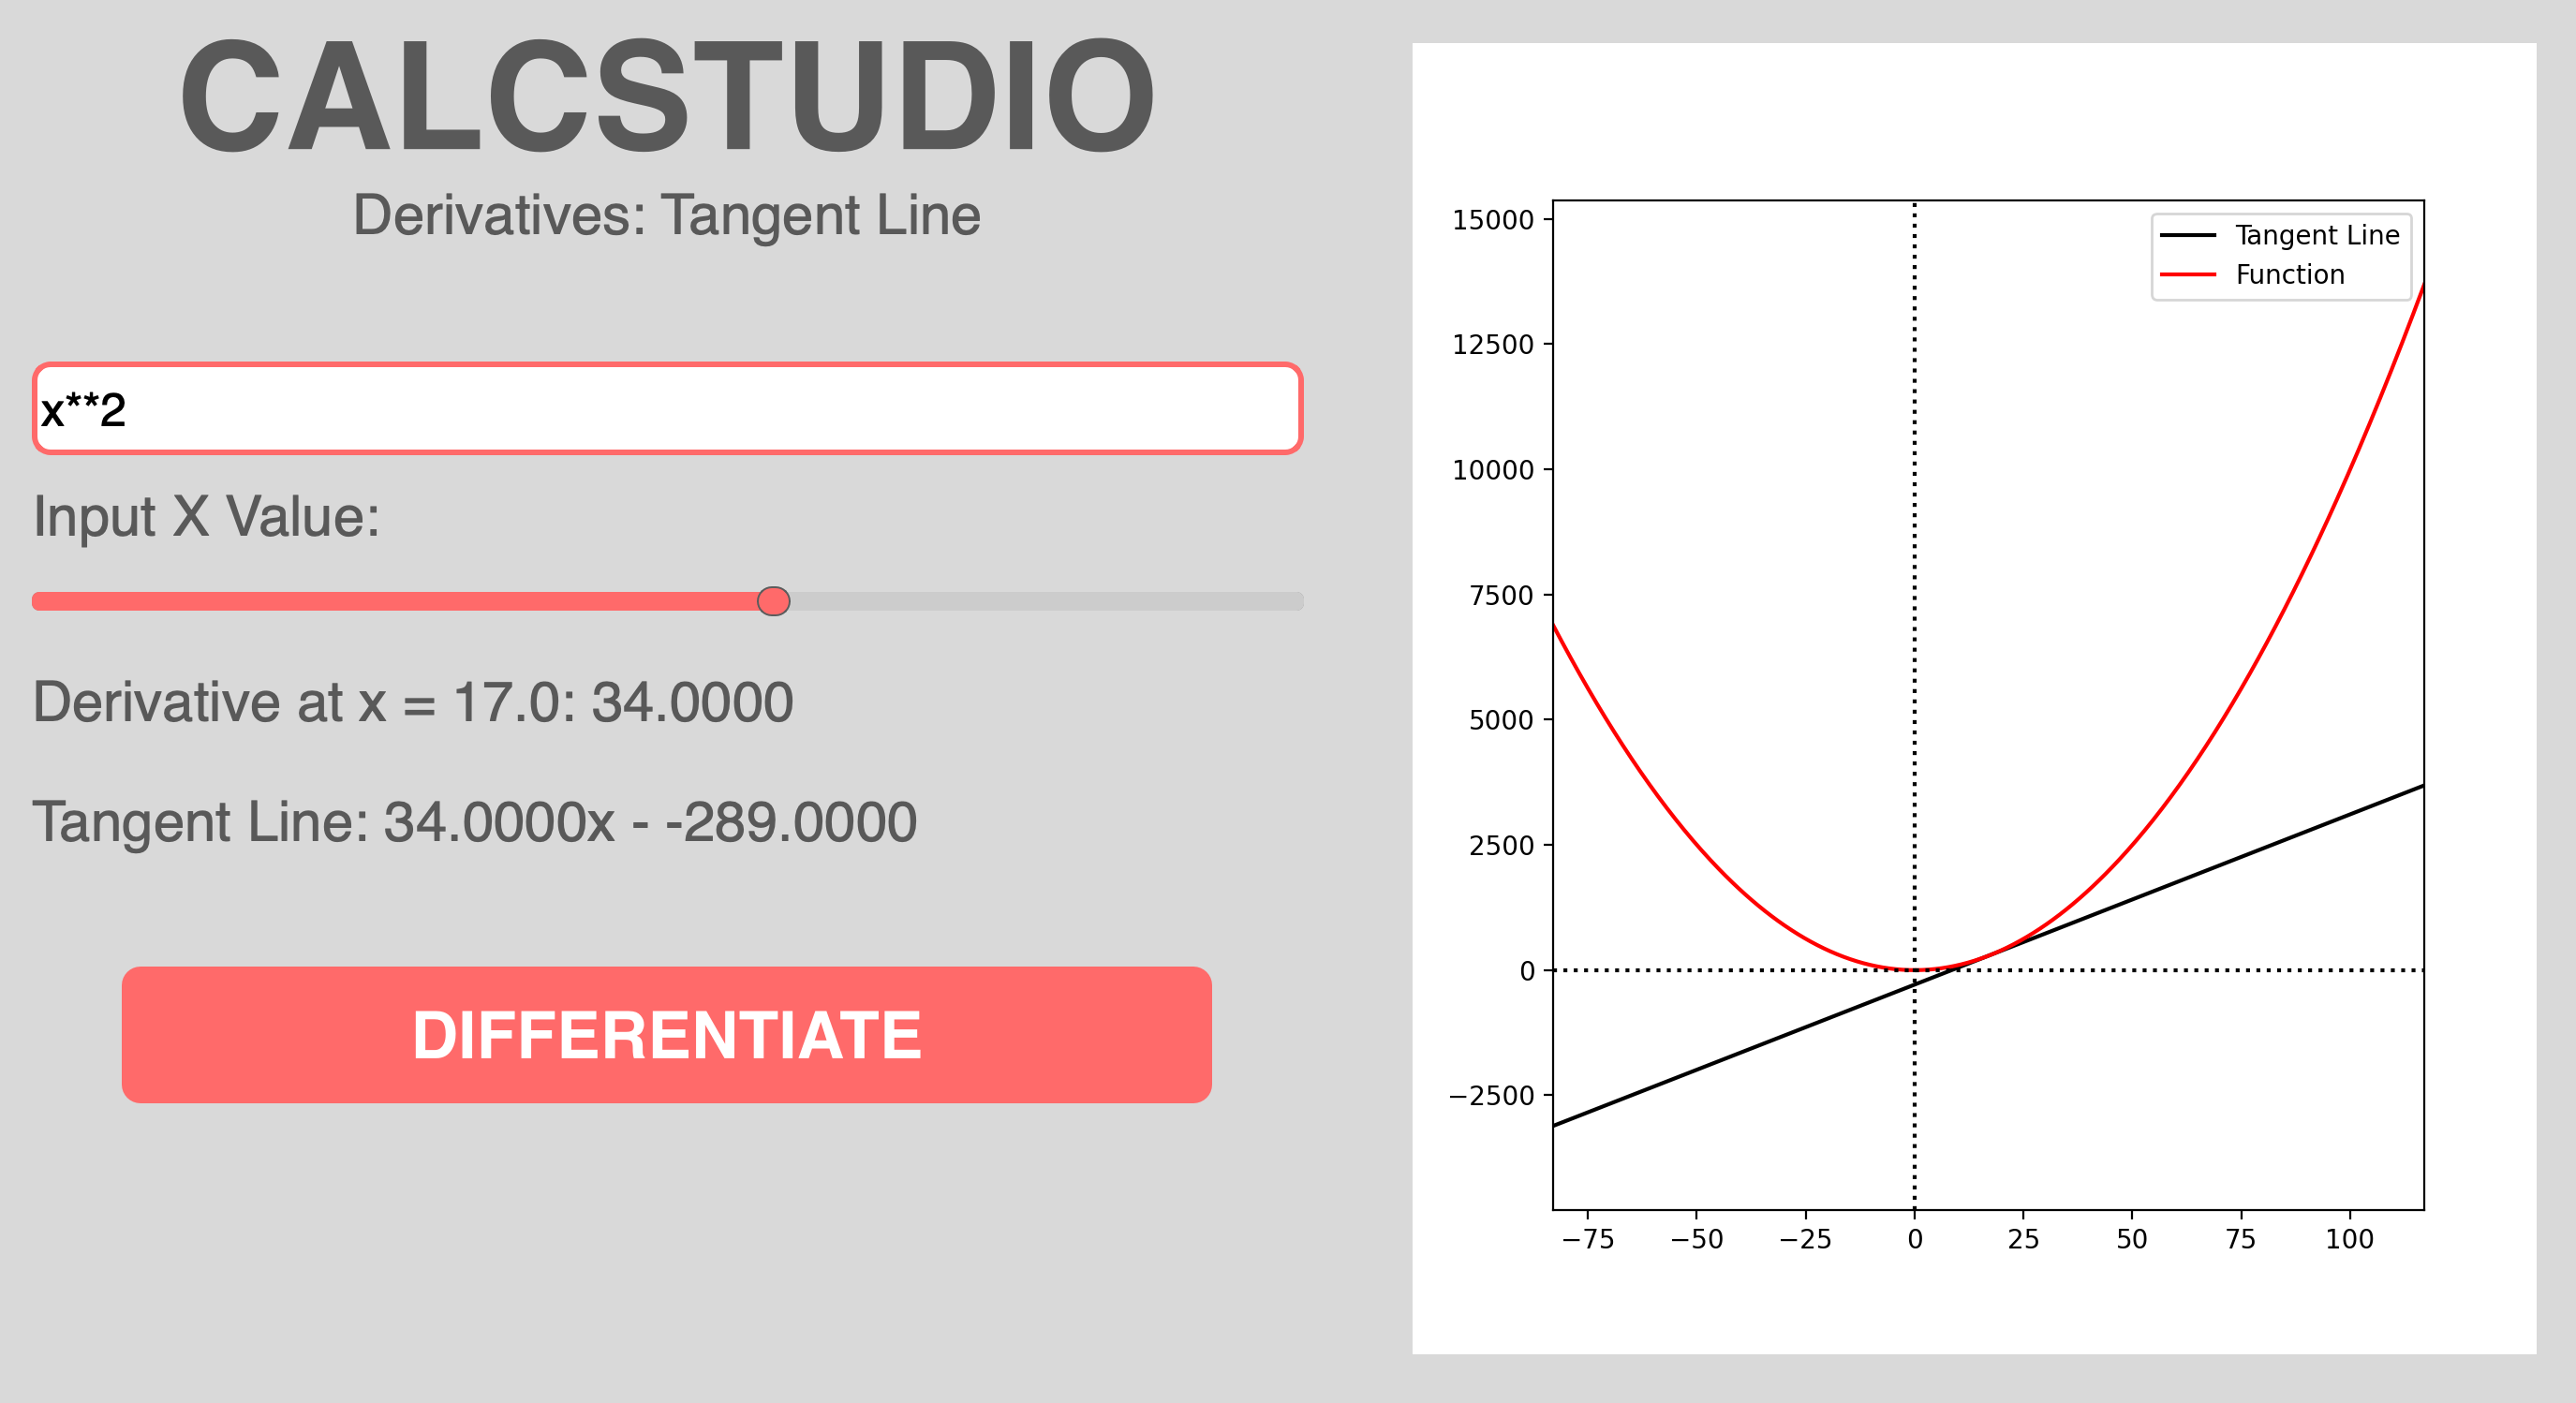
- Derivatives: Tangent Line at a Point > Given a function and a specific point, this feature visualizes what the tangent line of the function at that point would look like.
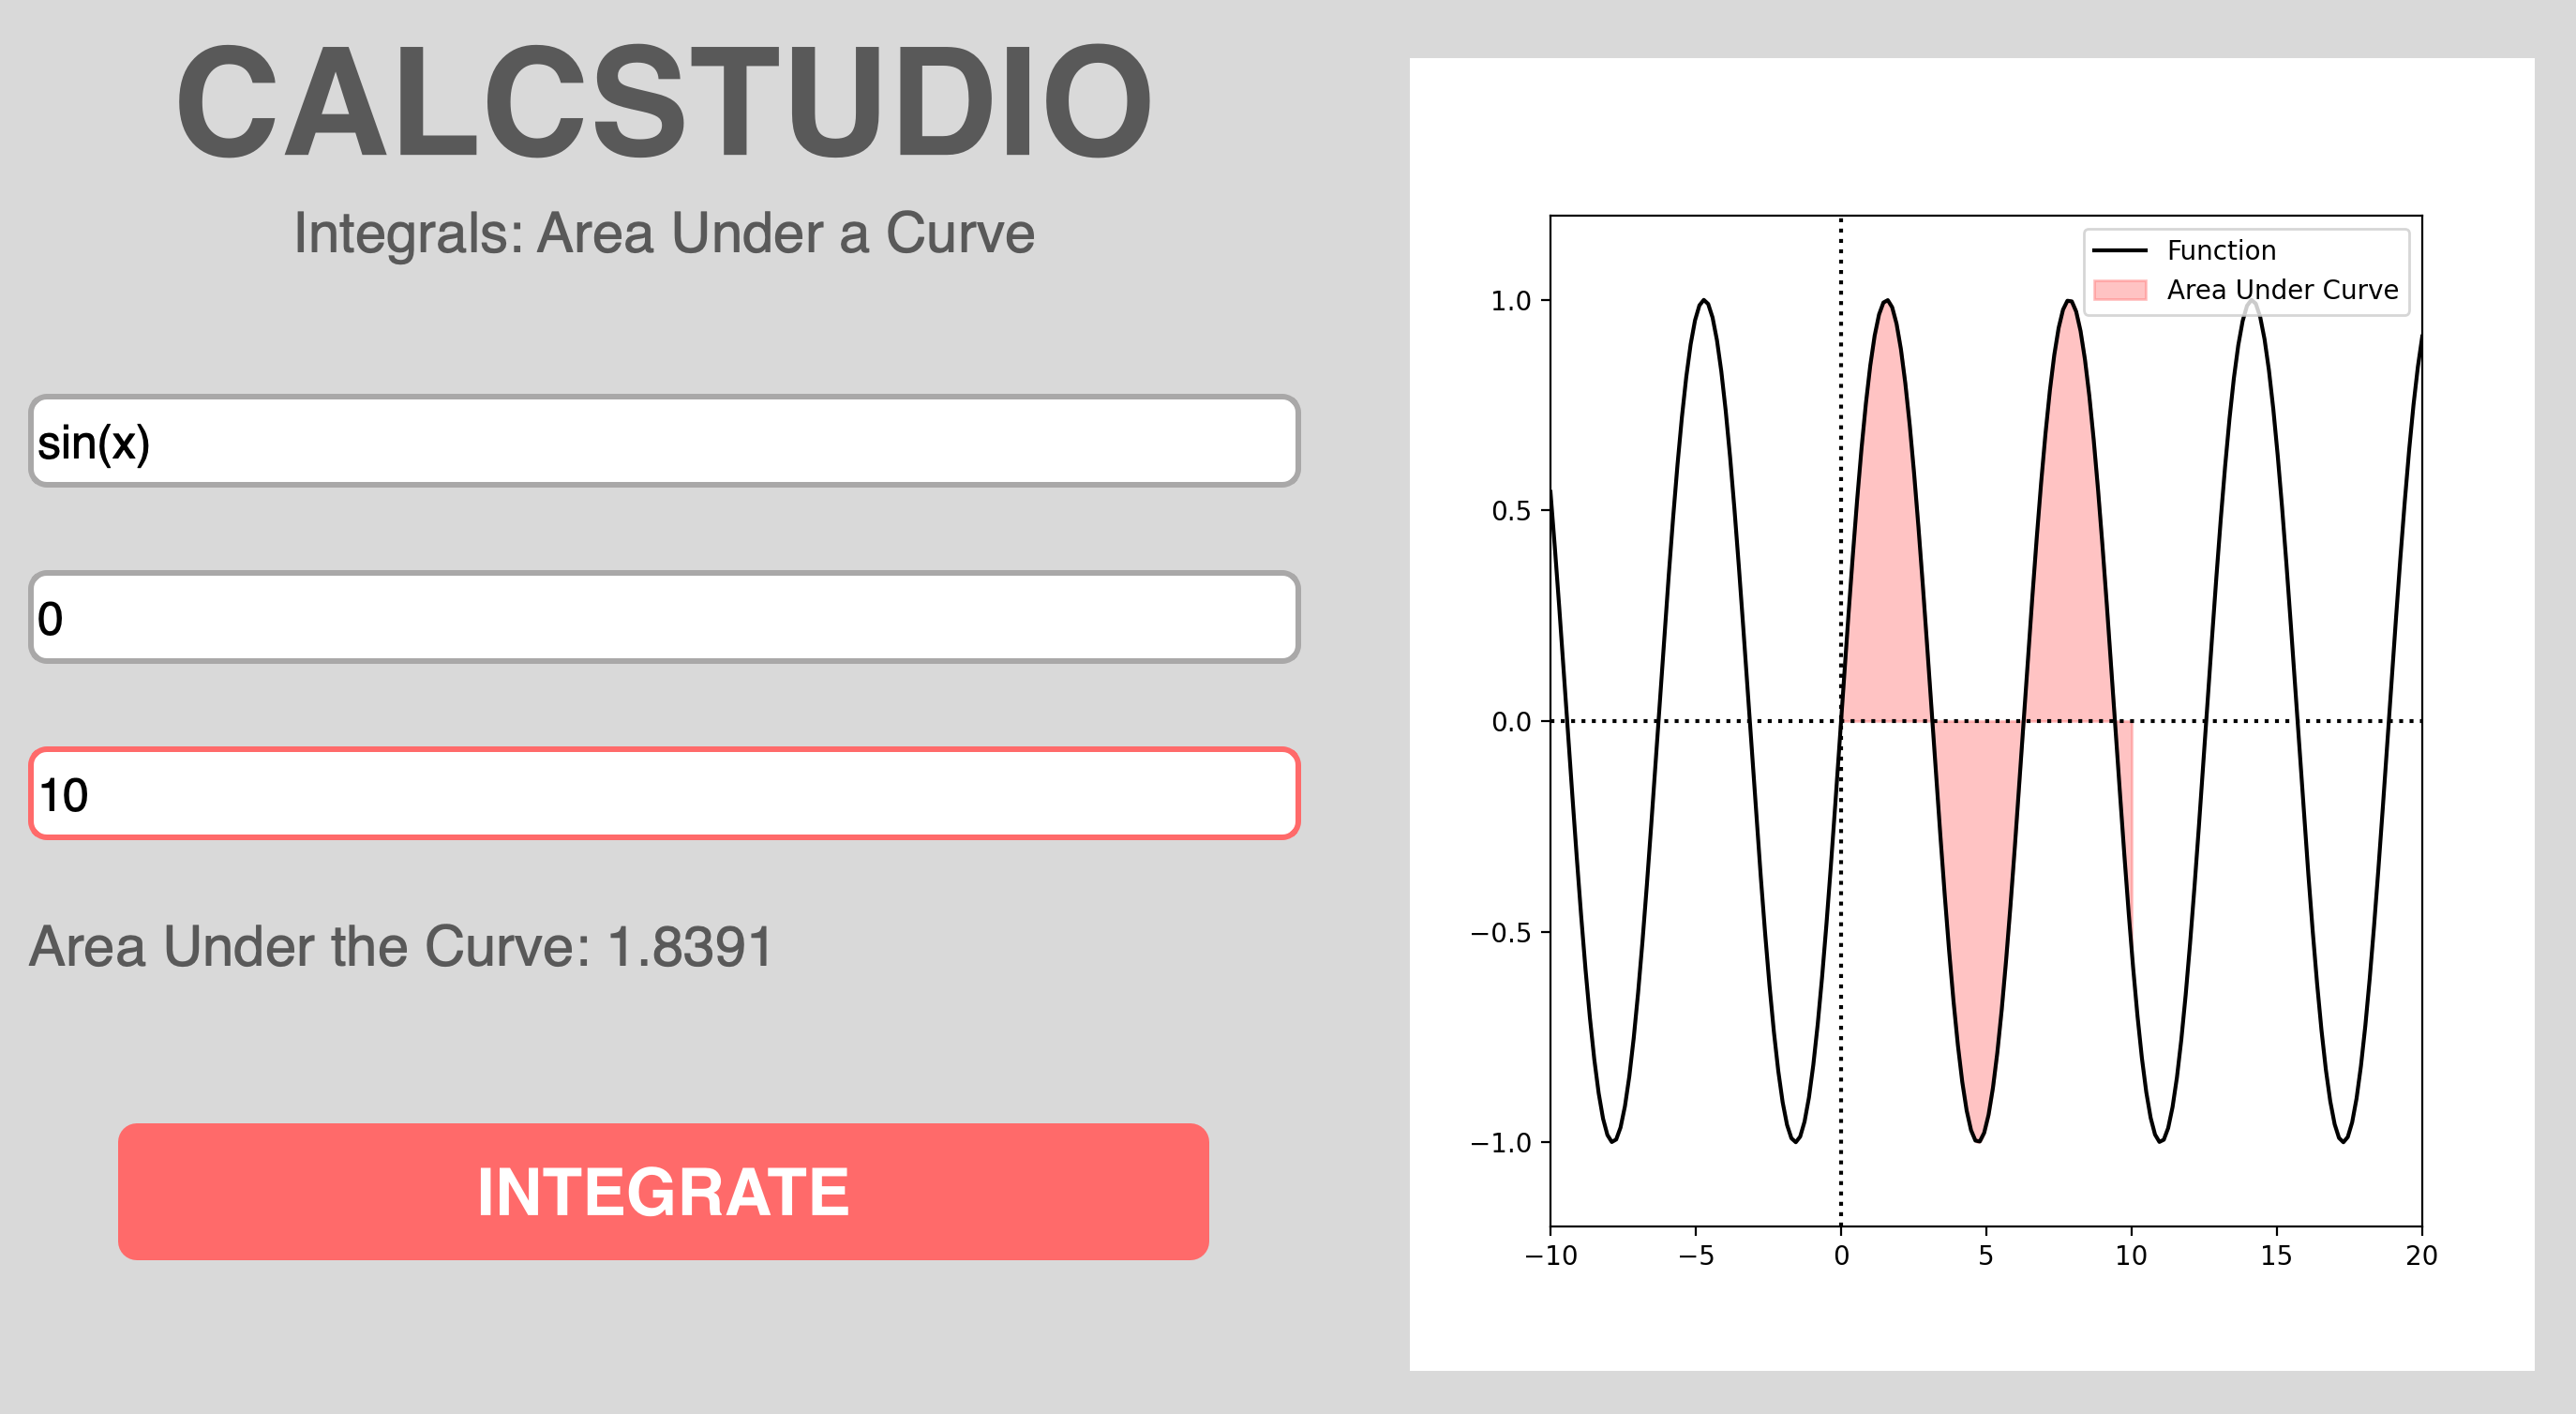
- Integrals: Area Under a Curve > Given a function and two points, this feature visualizes the area under a curve between two points.
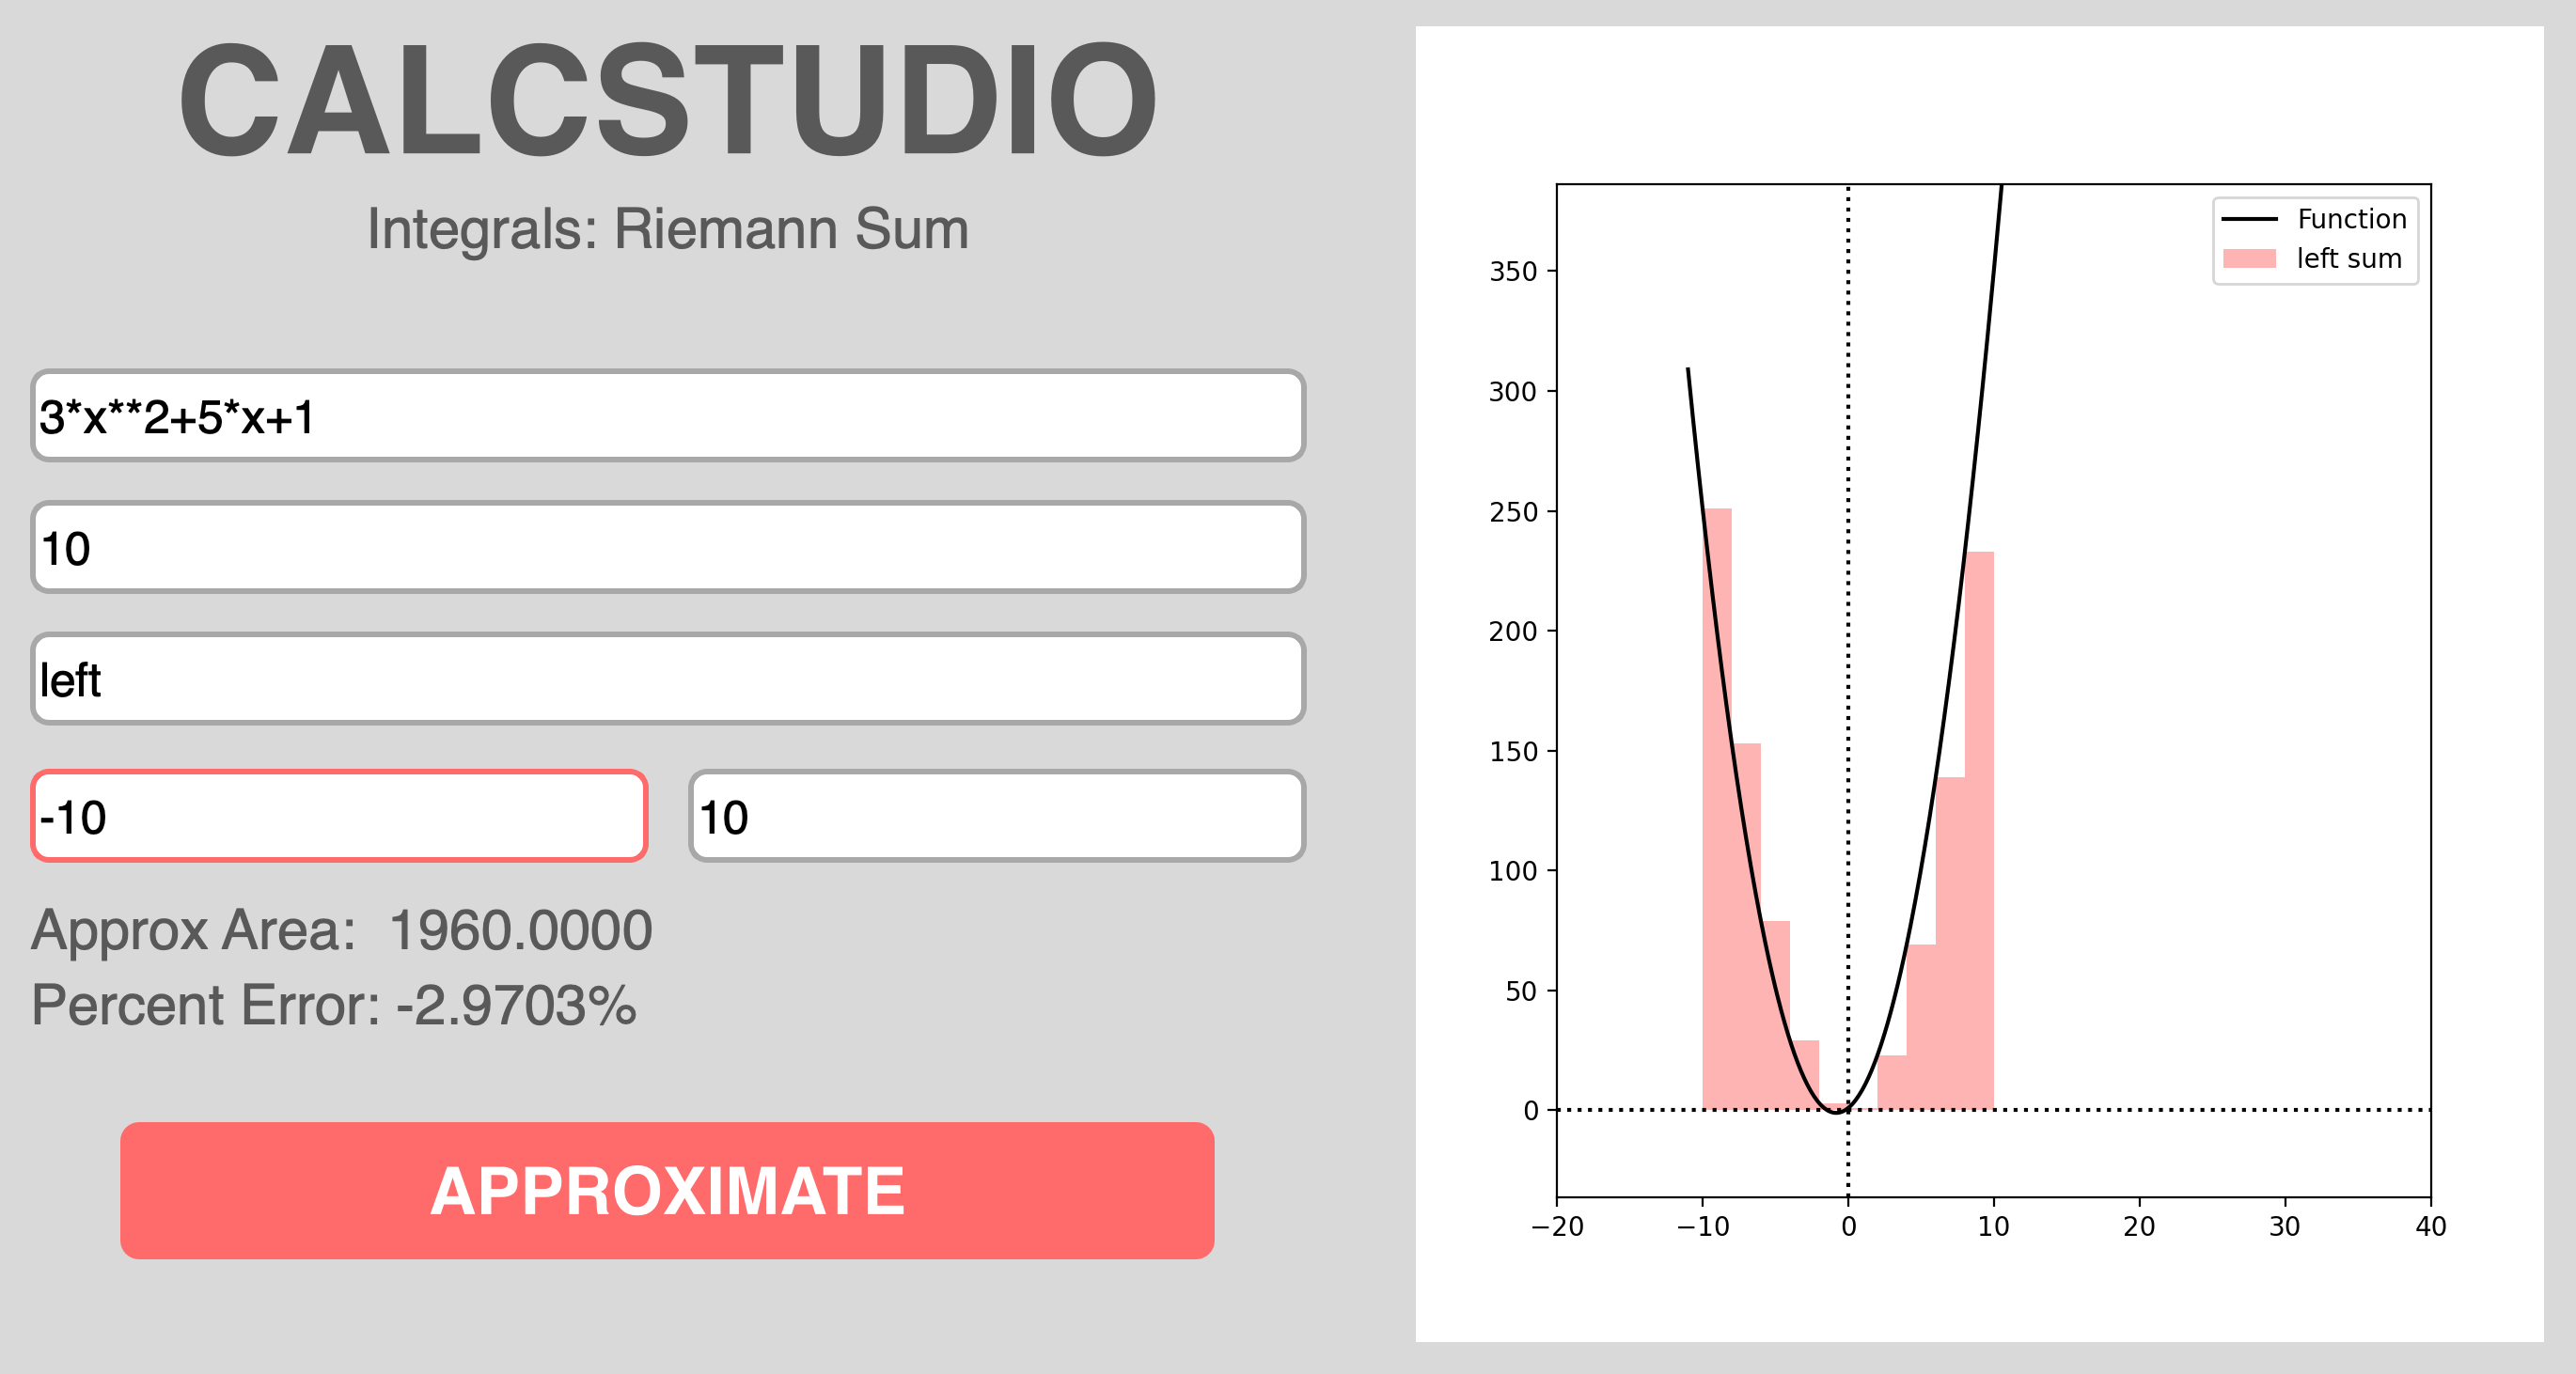
- Integrals: Riemann Sums > Given a function, number of rectangles, and two points, this feature approximates the are under a curve using Riemann sums and evaluates percent error.
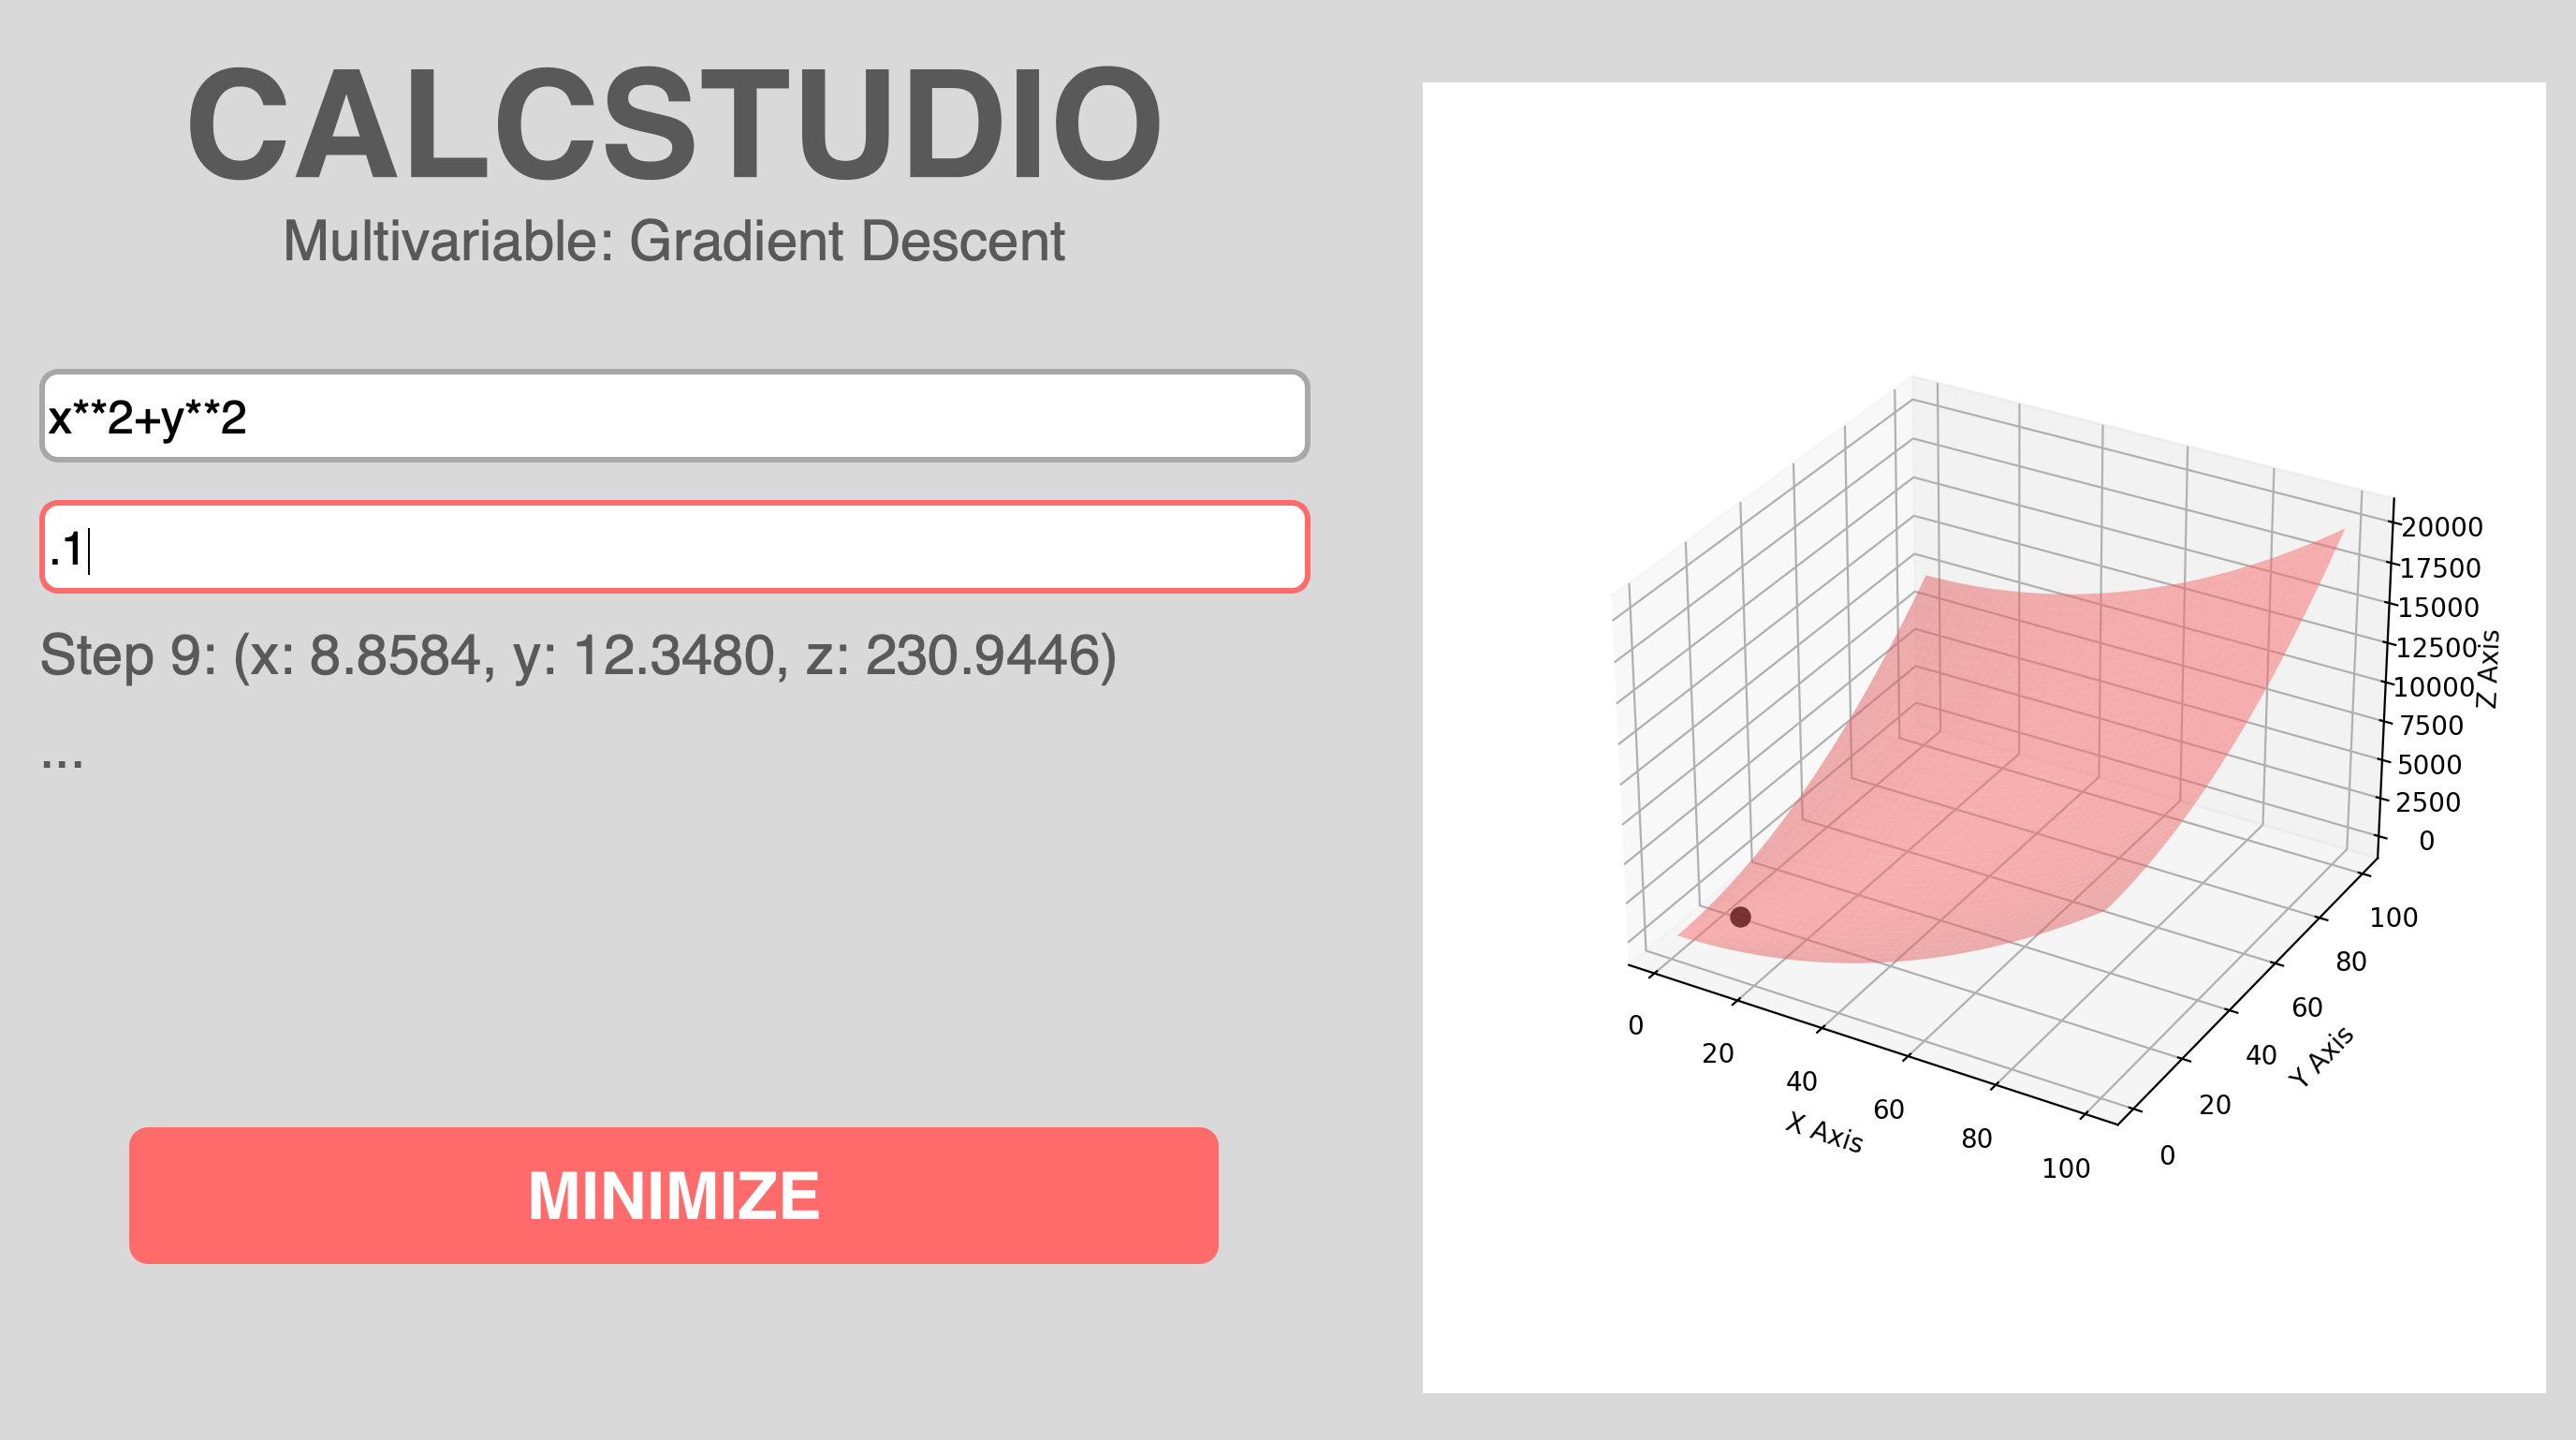
- Multivariable: Gradient Descent > Algorithm heavily used in machine learning to optimize parameters by minimizing a cost function.
- Responsive UI with PyQt 5 for smoother user experience
- Cross-platform standalone release
Coming soon: Responsive, interactive problem generator with an adaptive learning path powered by machine learning.
How to Use:
Step 1: Install the Application
Download the latest release from the download section of this READMe You can also download from: GitHub Releases
Step 2: Inputting a Function CalcStudio supports these main groups of functions; here is how you input them: Polynomials: x2, 3*x3 + 5 Exponentials: exp(x), 2x Logarithmic: log(x), log(x, 5) Trigonometric (Sin and Cosine): sin(x), cos(x) Roots: sqrt(x), x(3/2) Rational: 1/x, x/(x+1) Constants: 5, pi More function inputs will be supported soon
Step 3: Using the Modules
Derivatives: Tangent Line at Point - Input a function into the text box and press differentiate. Now when you move the x value slider you can see the tangent line move as your slider value changes. This module shows an output of the value of the derivative at that poin and the tangent line equation.
Integrals: Area Under a Curve - Input a function, first value, and last value and press integrate. After pressing the button you should see the graph show a curve and the area under the curves with bounds of the first and last value inputted. This module outputs the area under the curve.
Integrals: Riemann Sum Approximation - Input a function, number of rectangles used to approximate, type of approximation(left or right), and first and last value. After pressing approximate this module should output the function with the numbers of rectangles approximating the area under the function. It outputs the approximated area with rectangles and the percent error from the actual value under the curve.
Multivariable: Gradient Descent - Input a function (this input requires two inputs, x and a y, for example: x2 + y2) and a learning rate. Once minimized is pressed the module will display the function and show the step by step minimization of the function.
Who is this Application For:
- Students Studying AP Calculus AB/BC or Equivalent
- University Learners in Early STEM Math Courses
- Educators Seeking Visual Teaching Tools
- Anybody Curious about how Math works
Real World Use Cases:
- GCM High School in person summer workshop for 15 AP Calculus students
Screenshots:
Tech Stack:
- Python 3
- PyQt5
- Matplotlib
- Numpy
- Sympy
Author:
Developed by Aayush Koora